Movie-Lens-Dataset-Visualization-and-Prediction
Summary
This dataset (ml-latest-small) describes 5-star rating and free-text tagging activity from MovieLens, a movie recommendation service. It contains 100836 ratings and 3683 tag applications across 9742 movies. These data were created by 610 users between March 29, 1996 and September 24, 2018. This dataset was generated on September 26, 2018.
Users were selected at random for inclusion. All selected users had rated at least 20 movies. No demographic information is included. Each user is represented by an id, and no other information is provided.
The data are contained in the files links.csv, movies.csv, ratings.csv and tags.csv. More details about the contents and use of all these files follows.
This is a development dataset. As such, it may change over time and is not an appropriate dataset for shared research results. See available benchmark datasets if that is your intent.
This and other GroupLens data sets are publicly available for download at http://grouplens.org/datasets/.
Usage License
Neither the University of Minnesota nor any of the researchers involved can guarantee the correctness of the data, its suitability for any particular purpose, or the validity of results based on the use of the data set. The data set may be used for any research purposes under the following conditions:
- The user may not state or imply any endorsement from the University of Minnesota or the GroupLens Research Group.
- The user must acknowledge the use of the data set in publications resulting from the use of the data set (see below for citation information).
- The user may redistribute the data set, including transformations, so long as it is distributed under these same license conditions.
- The user may not use this information for any commercial or revenue-bearing purposes without first obtaining permission from a faculty member of the GroupLens Research Project at the University of Minnesota.
- The executable software scripts are provided “as is” without warranty of any kind, either expressed or implied, including, but not limited to, the implied warranties of merchantability and fitness for a particular purpose. The entire risk as to the quality and performance of them is with you. Should the program prove defective, you assume the cost of all necessary servicing, repair or correction.
In no event shall the University of Minnesota, its affiliates or employees be liable to you for any damages arising out of the use or inability to use these programs (including but not limited to loss of data or data being rendered inaccurate).
If you have any further questions or comments, please email grouplens-info@umn.edu
Citation
To acknowledge use of the dataset in publications, please cite the following paper:
F. Maxwell Harper and Joseph A. Konstan. 2015. The MovieLens Datasets: History and Context. ACM Transactions on Interactive Intelligent Systems (TiiS) 5, 4: 19:1–19:19. https://doi.org/10.1145/2827872
Further Information About GroupLens
GroupLens is a research group in the Department of Computer Science and Engineering at the University of Minnesota. Since its inception in 1992, GroupLens’s research projects have explored a variety of fields including:
- recommender systems
- online communities
- mobile and ubiquitious technologies
- digital libraries
- local geographic information systems
GroupLens Research operates a movie recommender based on collaborative filtering, MovieLens, which is the source of these data. We encourage you to visit http://movielens.org to try it out! If you have exciting ideas for experimental work to conduct on MovieLens, send us an email at grouplens-info@cs.umn.edu - we are always interested in working with external collaborators.
Content and Use of Files
Formatting and Encoding
The dataset files are written as comma-separated values files with a single header row. Columns that contain commas (,) are escaped using double-quotes ("). These files are encoded as UTF-8. If accented characters in movie titles or tag values (e.g. Misérables, Les (1995)) display incorrectly, make sure that any program reading the data, such as a text editor, terminal, or script, is configured for UTF-8.
User Ids
MovieLens users were selected at random for inclusion. Their ids have been anonymized. User ids are consistent between ratings.csv and tags.csv (i.e., the same id refers to the same user across the two files).
Movie Ids
Only movies with at least one rating or tag are included in the dataset. These movie ids are consistent with those used on the MovieLens web site (e.g., id 1 corresponds to the URL https://movielens.org/movies/1). Movie ids are consistent between ratings.csv, tags.csv, movies.csv, and links.csv (i.e., the same id refers to the same movie across these four data files).
Ratings Data File Structure (ratings.csv)
All ratings are contained in the file ratings.csv. Each line of this file after the header row represents one rating of one movie by one user, and has the following format:
userId,movieId,rating,timestamp
The lines within this file are ordered first by userId, then, within user, by movieId.
Ratings are made on a 5-star scale, with half-star increments (0.5 stars - 5.0 stars).
Timestamps represent seconds since midnight Coordinated Universal Time (UTC) of January 1, 1970.
Tags Data File Structure (tags.csv)
All tags are contained in the file tags.csv. Each line of this file after the header row represents one tag applied to one movie by one user, and has the following format:
userId,movieId,tag,timestamp
The lines within this file are ordered first by userId, then, within user, by movieId.
Tags are user-generated metadata about movies. Each tag is typically a single word or short phrase. The meaning, value, and purpose of a particular tag is determined by each user.
Timestamps represent seconds since midnight Coordinated Universal Time (UTC) of January 1, 1970.
Movies Data File Structure (movies.csv)
Movie information is contained in the file movies.csv. Each line of this file after the header row represents one movie, and has the following format:
movieId,title,genres
Movie titles are entered manually or imported from https://www.themoviedb.org/, and include the year of release in parentheses. Errors and inconsistencies may exist in these titles.
Genres are a pipe-separated list, and are selected from the following:
- Action
- Adventure
- Animation
- Children’s
- Comedy
- Crime
- Documentary
- Drama
- Fantasy
- Film-Noir
- Horror
- Musical
- Mystery
- Romance
- Sci-Fi
- Thriller
- War
- Western
- (no genres listed)
Links Data File Structure (links.csv)
Identifiers that can be used to link to other sources of movie data are contained in the file links.csv. Each line of this file after the header row represents one movie, and has the following format:
movieId,imdbId,tmdbId
movieId is an identifier for movies used by https://movielens.org. E.g., the movie Toy Story has the link https://movielens.org/movies/1.
imdbId is an identifier for movies used by http://www.imdb.com. E.g., the movie Toy Story has the link http://www.imdb.com/title/tt0114709/.
tmdbId is an identifier for movies used by https://www.themoviedb.org. E.g., the movie Toy Story has the link https://www.themoviedb.org/movie/862.
Use of the resources listed above is subject to the terms of each provider.
Cross-Validation
Prior versions of the MovieLens dataset included either pre-computed cross-folds or scripts to perform this computation. We no longer bundle either of these features with the dataset, since most modern toolkits provide this as a built-in feature. If you wish to learn about standard approaches to cross-fold computation in the context of recommender systems evaluation, see LensKit for tools, documentation, and open-source code examples.
Movie Lens Dataset Visualisation and Analysis
This dataset (ml-latest-small) describes 5-star rating and free-text tagging activity from MovieLens, a movie recommendation service. It contains 100836 ratings and 3683 tag applications across 9742 movies. These data were created by 610 users between March 29, 1996 and September 24, 2018. This dataset was generated on September 26, 2018.
Contents
- Formulate questions for Analysis
- Import Necessary Libraries
- Read In and Explore/Analyse the Data
- Descriptive Analytics and Visualization
- Final Summary and Results
- Model, Predict and Solve (If possible)
- Model Evaluation (If possible)
1. Formulate questions for Analysis
The main analysis will focus on answering the below questions. It’s important to note that the findings in this analysis are based on a sample and are not definitive.
- Find the Year with most Movies released
- What is the most common Genre ?
- Find the Avg. Ratings given for each Movie by different Users
- Movie with most No Users ratings.
- Which User has Rated more no.of Movies and what is that Users Avg. Rating ?
- Predict what would be the Rating a movie with specific Genres will get ?
2. Import Necessary Libraries
First off, we need to import several Python libraries such as numpy, pandas, matplotlib and seaborn.
#data analysis libraries
import numpy as np
import pandas as pd

#visualization libraries
import matplotlib.pyplot as plt
import seaborn as sns
%matplotlib inline
#ignore warnings
import warnings
warnings.filterwarnings('ignore')
3. Read in and Explore/Analyze the Data
It’s time to read in our data’s using pd.read_csv, and take a first look at the dimensions and data using the shape() and head() functions.
#import train and test CSV files
movie = pd.read_csv("movies.csv")
ratings = pd.read_csv("ratings.csv")
links = pd.read_csv("links.csv")
tags = pd.read_csv("tags.csv")
#take a look at the training data
print(movie.shape)
print(ratings.shape)
print(links.shape)
print(tags.shape,end="\n\n")
m=pd.read_csv("movies.csv")
movie.head(3)
links.head(3)
ratings.head(3)
tags.head(3)

#get a list of the features within the dataset
print("Movie : ", movie.columns,end="\n\n")
print("Rating : ", ratings.columns,end="\n\n")
print("Links : ", links.columns,end="\n\n")
print("Tags : ", tags.columns,end="\n\n")

movie.info()
ratings.info()
tags.info()
(9742, 3)
(100836, 4)
(9742, 3)
(3683, 4)

Movie :  Index(['movieId', 'title', 'genres'], dtype='object')

Rating :  Index(['userId', 'movieId', 'rating', 'timestamp'], dtype='object')

Links :  Index(['movieId', 'imdbId', 'tmdbId'], dtype='object')

Tags :  Index(['userId', 'movieId', 'tag', 'timestamp'], dtype='object')

<class 'pandas.core.frame.DataFrame'>
RangeIndex: 9742 entries, 0 to 9741
Data columns (total 3 columns):
movieId    9742 non-null int64
title      9742 non-null object
genres     9742 non-null object
dtypes: int64(1), object(2)
memory usage: 228.5+ KB
<class 'pandas.core.frame.DataFrame'>
RangeIndex: 100836 entries, 0 to 100835
Data columns (total 4 columns):
userId       100836 non-null int64
movieId      100836 non-null int64
rating       100836 non-null float64
timestamp    100836 non-null int64
dtypes: float64(1), int64(3)
memory usage: 3.1 MB
<class 'pandas.core.frame.DataFrame'>
RangeIndex: 3683 entries, 0 to 3682
Data columns (total 4 columns):
userId       3683 non-null int64
movieId      3683 non-null int64
tag          3683 non-null object
timestamp    3683 non-null int64
dtypes: int64(3), object(1)
memory usage: 115.2+ KB
- Numerical Features: movieId , userId , rating
- Categorical Features: tags , genres
- Alphanumeric Features: None
The data types for each feature
| Name | Type |
|---|---|
| movieId | int |
| userId | int |
| title | string |
| genres | string |
| rating | float |
| tag | string |
Now that we have an idea of what kinds of features we’re working with, we can see how much information we have about each of them.
# Droping the timestamp column from ratings and tags file
ratings.drop(columns='timestamp',inplace=True)
tags.drop(columns='timestamp',inplace=True)
Some Observations:
There are a total of 9742 Movie's in our dataset with 100836 Users Rating the movie and 3683 Tags.
- userId: Unique Id provided for each User
-
userId were selected at random for inclusion. Their ids have been anonymized. User ids are consistent between
ratings.csvandtags.csv(i.e., the same id refers to the same user across the two files). - movieId: Unique Id provided for each Movie
-
Only movies with at least one rating or tag are included in the dataset. These movie ids are consistent with those used on the MovieLens web site (e.g., id
1corresponds to the URL Movie Lens. Movie ids are consistent betweenratings.csv,tags.csv,movies.csv, andlinks.csv(i.e., the same id refers to the same movie across these four data files). - rating (
rating.csv): Ratings are made on a 5-star scale, with half-star increments (0.5 stars - 5.0 stars). - All Ratings are contained in the file
ratings.csv. Each line of this file after the header row represents one rating of one movie by one user -
Mean show the average rating is 3.2-Star
- genres: Genres are a pipe-separated list, and are selected from the following:
- Action
- Adventure
- Animation
- Children’s
- Comedy
- Crime
- Documentary
- Drama
- Fantasy
- Film-Noir
- Horror
- Musical
- Mystery
- Romance
- Sci-Fi
- Thriller
- War
- Western
- (no genres listed)
Suggestions:
- The Timestamp column from both
tags.csvandratings.csvdoes not contribute much. So lets drop them links.csvhas no usefull information hence lets drop the table.- In
movie.csvfrom the Title column we can extrct the year in which the movie was released. - For further prediction the genres column has to extracted and all Individual Genres has to br Encoded into Numerical Values ( eg. One-Hot-Encoding method )
4. Descriptive Analytics and Visualization
#Extracting the year from the Title
movie['Year'] = movie['title'].str.extract('.*\((.*)\).*',expand = False)
Now that we have extracted the Year from the Tilte lets find out which Year has the highest number of Movie releases
#Ploting a Graph with No.of Movies each Year corresponding to its Year
plt.plot(movie.groupby('Year').title.count())
plt.show()
a=movie.groupby('Year').title.count()
print('Max No.of Movies Relesed =',a.max())
for i in a.index:
    if a[i] == a.max():
        print('Year =',i)
a.describe()
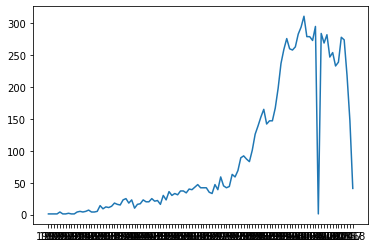
Max No.of Movies Relesed = 311
Year = 2002


count    107.000000
mean      90.934579
std      102.122223
min        1.000000
25%       16.000000
50%       39.000000
75%      150.000000
max      311.000000
Name: title, dtype: float64
1.
As per the above result we got to know that in 2002 has the highest number of movie releases with 311 Movies.
On an Avg. there are around 90 Movies releasing per Year.
Now Lets extract the individual Genres from the Genres column. And lets create columns with the each Genres as the name and allot " 1 " if the movie has the Genre else " 0 "
# Seperate the Geners Column and Encoding them with One-Hot-Encoding Method.
genres=[]
for i in range(len(movie.genres)):
    for x in movie.genres[i].split('|'):
        if x not in genres:
            genres.append(x)

len(genres)
for x in genres:
    movie[x] = 0
for i in range(len(movie.genres)):
    for x in movie.genres[i].split('|'):
        movie[x][i]=1
movie
| movieId | title | genres | Year | Adventure | Animation | Children | Comedy | Fantasy | Romance | ... | Horror | Mystery | Sci-Fi | War | Musical | Documentary | IMAX | Western | Film-Noir | (no genres listed) | |
|---|---|---|---|---|---|---|---|---|---|---|---|---|---|---|---|---|---|---|---|---|---|
| 0 | 1 | Toy Story (1995) | Adventure|Animation|Children|Comedy|Fantasy | 1995 | 1 | 1 | 1 | 1 | 1 | 0 | ... | 0 | 0 | 0 | 0 | 0 | 0 | 0 | 0 | 0 | 0 |
| 1 | 2 | Jumanji (1995) | Adventure|Children|Fantasy | 1995 | 1 | 0 | 1 | 0 | 1 | 0 | ... | 0 | 0 | 0 | 0 | 0 | 0 | 0 | 0 | 0 | 0 |
| 2 | 3 | Grumpier Old Men (1995) | Comedy|Romance | 1995 | 0 | 0 | 0 | 1 | 0 | 1 | ... | 0 | 0 | 0 | 0 | 0 | 0 | 0 | 0 | 0 | 0 |
| 3 | 4 | Waiting to Exhale (1995) | Comedy|Drama|Romance | 1995 | 0 | 0 | 0 | 1 | 0 | 1 | ... | 0 | 0 | 0 | 0 | 0 | 0 | 0 | 0 | 0 | 0 |
| 4 | 5 | Father of the Bride Part II (1995) | Comedy | 1995 | 0 | 0 | 0 | 1 | 0 | 0 | ... | 0 | 0 | 0 | 0 | 0 | 0 | 0 | 0 | 0 | 0 |
| ... | ... | ... | ... | ... | ... | ... | ... | ... | ... | ... | ... | ... | ... | ... | ... | ... | ... | ... | ... | ... | ... |
| 9737 | 193581 | Black Butler: Book of the Atlantic (2017) | Action|Animation|Comedy|Fantasy | 2017 | 0 | 1 | 0 | 1 | 1 | 0 | ... | 0 | 0 | 0 | 0 | 0 | 0 | 0 | 0 | 0 | 0 |
| 9738 | 193583 | No Game No Life: Zero (2017) | Animation|Comedy|Fantasy | 2017 | 0 | 1 | 0 | 1 | 1 | 0 | ... | 0 | 0 | 0 | 0 | 0 | 0 | 0 | 0 | 0 | 0 |
| 9739 | 193585 | Flint (2017) | Drama | 2017 | 0 | 0 | 0 | 0 | 0 | 0 | ... | 0 | 0 | 0 | 0 | 0 | 0 | 0 | 0 | 0 | 0 |
| 9740 | 193587 | Bungo Stray Dogs: Dead Apple (2018) | Action|Animation | 2018 | 0 | 1 | 0 | 0 | 0 | 0 | ... | 0 | 0 | 0 | 0 | 0 | 0 | 0 | 0 | 0 | 0 |
| 9741 | 193609 | Andrew Dice Clay: Dice Rules (1991) | Comedy | 1991 | 0 | 0 | 0 | 1 | 0 | 0 | ... | 0 | 0 | 0 | 0 | 0 | 0 | 0 | 0 | 0 | 0 |
9742 rows × 24 columns
Now that we have the data in the Genres Column converted in to Numerical values in different columns, Lets Drop the Genres Column
movie.drop(columns='genres',inplace=True)
movie.sort_index(inplace=True)
x={}
for i in movie.columns[4:23]:
    x[i]=movie[i].value_counts()[1]
    print("{}    \t\t\t\t{}".format(i,x[i]))

plt.bar(height=x.values(),x=x.keys())
plt.show()
Animation    				611
Children    				664
Comedy    				3756
Fantasy    				779
Romance    				1596
Drama    				4361
Action    				1828
Crime    				1199
Thriller    				1894
Horror    				978
Mystery    				573
Sci-Fi    				980
War    				382
Musical    				334
Documentary    				440
IMAX    				158
Western    				167
Film-Noir    				87
(no genres listed)    				34
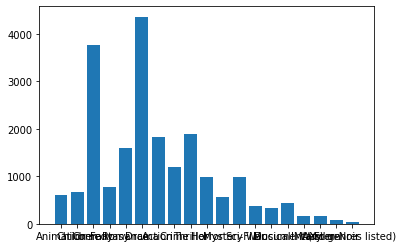
2.
From the above we can say that Drama is the most Comman Genre released in the Movie Field with 4361 Movies followed by Comedy with 3756 Movies and so on ………..
3.
As we can see that each movies is being rated by many Users, lets Group them by "movieId" and rate each movie with the mean of the Rating given by different Users.
#Add a Column `rating` in movie DF and assign them with the Mean Movie Rating for that Movie.
x=ratings.groupby('movieId').rating.mean()
movie = pd.merge(movie,x,how='outer',on='movieId')
movie['rating'].fillna('0',inplace=True)
# Now Lets group all the ratings with respect to movieId and count the no of Users
x = ratings.groupby('movieId',as_index=False).userId.count()
x.sort_values('userId',ascending=False,inplace=True)
y = pd.merge(movie,x,how='outer',on='movieId')

y.drop(columns=[i for i in movie.columns[2:23]],inplace=True)

y.sort_values(['userId','rating'],ascending=False)
| movieId | title | rating | userId | |
|---|---|---|---|---|
| 314 | 356 | Forrest Gump (1994) | 4.16413 | 329.0 |
| 277 | 318 | Shawshank Redemption, The (1994) | 4.42902 | 317.0 |
| 257 | 296 | Pulp Fiction (1994) | 4.19707 | 307.0 |
| 510 | 593 | Silence of the Lambs, The (1991) | 4.16129 | 279.0 |
| 1939 | 2571 | Matrix, The (1999) | 4.19245 | 278.0 |
| ... | ... | ... | ... | ... |
| 5749 | 30892 | In the Realms of the Unreal (2004) | 0 | NaN |
| 5824 | 32160 | Twentieth Century (1934) | 0 | NaN |
| 5837 | 32371 | Call Northside 777 (1948) | 0 | NaN |
| 5957 | 34482 | Browning Version, The (1951) | 0 | NaN |
| 7565 | 85565 | Chalet Girl (2011) | 0 | NaN |
9742 rows × 4 columns
4.
From the above table we can say that Forest Gump (1994) has the Highest no.of. Ratings with 4.16 Stars by 329 Users as average.
Followed by Shawshank Redemption, The (1994) with 317 User Ratings and 4.42 Stars as average and so on.
#find the user with highest no.of. movie ratings and that users mean rating.
x = ratings.groupby('userId',as_index=False).movieId.count()
y = ratings.groupby('userId',as_index=False).rating.mean()
x = pd.merge(x,y,how='outer',on='userId')
x.describe()
| userId | movieId | rating | |
|---|---|---|---|
| count | 610.000000 | 610.000000 | 610.000000 |
| mean | 305.500000 | 165.304918 | 3.657222 |
| std | 176.236111 | 269.480584 | 0.480635 |
| min | 1.000000 | 20.000000 | 1.275000 |
| 25% | 153.250000 | 35.000000 | 3.360000 |
| 50% | 305.500000 | 70.500000 | 3.694385 |
| 75% | 457.750000 | 168.000000 | 3.997500 |
| max | 610.000000 | 2698.000000 | 5.000000 |
x.sort_values('movieId',ascending=False)
| userId | movieId | rating | |
|---|---|---|---|
| 413 | 414 | 2698 | 3.391957 |
| 598 | 599 | 2478 | 2.642050 |
| 473 | 474 | 2108 | 3.398956 |
| 447 | 448 | 1864 | 2.847371 |
| 273 | 274 | 1346 | 3.235884 |
| ... | ... | ... | ... |
| 441 | 442 | 20 | 1.275000 |
| 568 | 569 | 20 | 4.000000 |
| 319 | 320 | 20 | 3.525000 |
| 575 | 576 | 20 | 3.100000 |
| 52 | 53 | 20 | 5.000000 |
610 rows × 3 columns
5.
From above we found that userId - 414 has given the Highest no.of Ratings with 2698 and an Average of 3.39 Stars followed by userId-599 with 2478 Ratings and an Average of 2.64 Stars and so on …
Final Summary and Results
- Find the Year with most Movies Released
- The Year with most no.of Movies Released is
2002with311Movie
- The Year with most no.of Movies Released is
- What is the most Common Genre ?
- The Most comman Genre is
Dramawith4361 Moviesfollowed byComedywith3756 Movies
- The Most comman Genre is
- Find the Avg. Ratings given for each movie by different users
- The Avg. Rating for each Movie is calculated and updated to the Movie DataFrame
- Movie with most No Users ratings.
- The Movie with most no.of Users ratings is
Forest Gump (1994)with Highest no.of. Ratings with4.16 Starsby329 Usersas Average followed byShawshank Redemption, The (1994)with317 User Ratingsand4.42 Starsas Average.
- The Movie with most no.of Users ratings is
- Which User has Rated More No. of Movies And what is that users Avg. Rating ?
- The User with Highest no.of Ratings and their Avg. Rating is
userId-414with2698no.of Ratings and a Average Rating of3.39 Starsfollowed byuserId-599with2478Ratings with Average Rating of2.64 Stars
- The User with Highest no.of Ratings and their Avg. Rating is
for i in movie.columns[3:]:
    movie[i] = movie[i].astype(int)
6. Model, Predict and Solve
#importing necessary packages for model prediction and evaluation
import sklearn
from sklearn.ensemble import RandomForestRegressor
from sklearn.metrics import mean_absolute_error
from sklearn.model_selection import train_test_split
We will use RandomForestRegressor Model to Predict the Rating of a movie with it’s Genres given.
#split the data into features and results
X = movie[movie.columns[3:23]]
y = movie[movie.columns[-1]]
As we know that the Genres are Enocded (with One-Hot-Encoding method) which is from the 3'rd column to the 23rd column are set as features and the Ratings (last column) is the expected result.
#spliting the data into Train Test and Validation sets
X_train , X_test , y_train , y_test = train_test_split(X ,y ,test_size=0.20 ,random_state = 1 ,shuffle = True)
Using sklearn.model_selection.train_test_split function we will split the whole data into train data and test data
Here I am assigning 20% for test data and the rest 80% for training data
model = RandomForestRegressor(n_estimators=560,random_state=42)
model.fit(X_train,y_train)
print(mean_absolute_error(model.predict(X_train),y_train))
0.6273838864882512
For the Exact same Data that we trained with,gives a error of 0.62 stars
I have set the n_estimators to 560 as it is results in less error than others after manually testing with multiple values.
Now let’s try predicting the Ratings with the Test data and see the output and how well the model predicted.
preds = model.predict(X_test)
preds
array([4.13091037, 2.70301961, 3.02737812, ..., 3.27549095, 3.19069404,
       3.15317189])
print(mean_absolute_error(y_test,preds))
0.7005609442537233
From the above results we can say that the model perdicts the Ratings for a movie with ± 0.70 deviated from the actual value.
Results
As the analysis are based on a sample and are not definitive the model is quite reliable and for Predicting the Rating of a Movie with it’s Genres given